This is an updated chart of the flow of financial savings and debt in the euro area (EA).
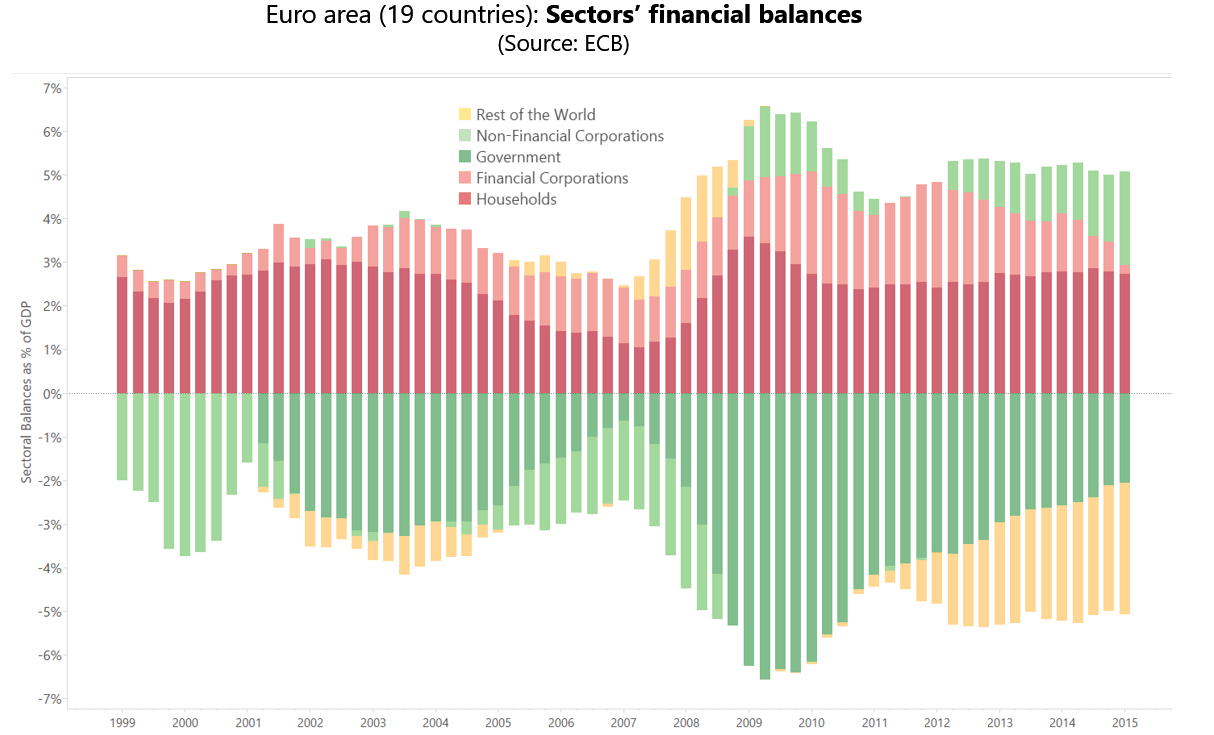
For each quarter, the red bars (when positive) measure the flow of financial savings to resident households (dark red) and financial corporations (light red).
The flow of financial savings has been consistently positive throughout the period, reflecting the quarterly addition to the stock of private savings. Notice the recent decline of financial savings of financial corporations.
The green bars (when negative) measure the source of private savings internal to the EA, i.e., the net spending by resident non-financial corporations (light green) and the net spending by all 19 consolidated EA governments (dark green).
The flow of debt originating from net government spending in the EA economy (dark green) has been persistently declining since 2010, consistently with the policy of containing government deficits and debts in the EA (aka “austerity”).
The net spending by private non-financial corporations (light green) is evident in the first and in the middle part of the period considered, when business investment was generating a flow of financial savings to other sectors.
Since 2009, however, the private business sector (producing the output of the EA) has been saving, instead of spending on investment and productive capacity. This is displayed by the the light green bar turning positive, reflecting the fact that since 2009 private manufacturers have demanded savings rather than contributing to make savings possible through their net spending.
How did the EA manage to stay afloat with both households and firms trying to save their income while governments are less and less willing to support savings through their net spending?
The answer lies with the yellow bars. When positive, they indicate that foreigners acquire a fraction of the savings generated in the EA by net selling their output to the EA. This is when the EA net imports from abroad.
Since 2010, however, and increasingly so in the past three years, the yellow bar has turned negative (and bigger in size than governments’ net spending), reflecting foreigners’ contribution to the desired savings in the EA. This happens when the EA acquires net claims abroad in exchange for output produced in the EA and to be consumed by foreigners (i.e., the EA is selling abroad more than it imports).
The current combination of sectoral balances makes the EA highly vulnerable. If private corporations remain net savers in a weak economy, and if governments consider their current deficit levels just about good enough to meet their fiscal rules, any turbulence originating from a rising value of the euro in the foreign exchange markets or from a further slowdown in the U.S. would leave private savings with no support and set the conditions for another recession.